Learn how to measure the performance of your Go code using the standard testing package by writing and running benchmarks locally and continuously in CI to catch regressions.
Go has first-class benchmarking built into its standard library — no external
framework needed. The testing package provides testing.B, which handles
iteration control, timing, memory tracking, sub-benchmarks, and parallel
execution out of the box. Every Go developer already has the tools installed.Benchmarks live in _test.go files alongside your code, run with go test, and
integrate with the Go ecosystem’s profiling tools (pprof, benchstat).
Benchmark functions must start with Benchmark and accept *testing.B.
b.Loop() (Go 1.24+) controls iteration. Iteration count and timing are
handled automatically.
The function lives in a _test.go file, just like unit tests.
b.Loop() was introduced in Go 1.24. It replaces the older
for i := 0; i < b.N; i++ pattern and is more precise — it automatically resets
the timer, and the compiler is prevented from optimizing away the loop body. If
you are on an older Go version, use the b.N pattern instead:
Legacy pattern (before Go 1.24)
func BenchmarkFibonacci(b *testing.B) { for i := 0; i < b.N; i++ { Fibonacci(20) }}
$ go test -bench=.goos: linuxgoarch: amd64pkg: example.com/benchcpu: Intel(R) Xeon(R) Platinum 8488CBenchmarkFibonacci-8 38594 31076 ns/opPASSok example.com/bench 1.207s
The highlighted line breaks down as follows:
BenchmarkFibonacci-8         38594        31076 ns/op
        ^                     ^            ^
        |                     |            |
        |                     |     time per iteration
        |              number of iterations
    benchmark name
The framework automatically adjusts the iteration count to run for at least 1
second by default.The -8 suffix on BenchmarkFibonacci-8 is the
GOMAXPROCS value, defaulting to the
number of available CPUs.
The two extra columns show bytes allocated per operation and number of
allocations per operation. These are essential for catching allocation
regressions — even if latency stays flat, increased allocations put pressure on
the garbage collector.
The exponential growth of recursive Fibonacci is clearly visible: n=5 takes
21ns, n=30 takes 3.8ms — a factor of 180,000x.You can filter sub-benchmarks from the command line:
Sub-benchmarks make algorithm comparison straightforward:
fib_test.go
func FibonacciIterative(n int) int { if n <= 1 { return n } a, b := 0, 1 for i := 2; i <= n; i++ { a, b = b, a+b } return b}func BenchmarkAlgorithms(b *testing.B) { for _, n := range []int{10, 20, 30} { b.Run(fmt.Sprintf("recursive/n=%d", n), func(b *testing.B) { for b.Loop() { Fibonacci(n) } }) b.Run(fmt.Sprintf("iterative/n=%d", n), func(b *testing.B) { for b.Loop() { FibonacciIterative(n) } }) }}
At n=30, the iterative version is 377,000x faster than the recursive one
(10ns vs 3.8ms). The hierarchical sub-benchmark naming makes it easy to compare
across both dimensions.
When your benchmark has expensive one-time setup, use b.ResetTimer() to
exclude it from measurements:
Excluding setup
func BenchmarkProcess(b *testing.B) { data := expensiveSetup() // NOT measured b.ResetTimer() for i := 0; i < b.N; i++ { process(data) // MEASURED }}
With b.Loop() (Go 1.24+), the timer is automatically reset on the first
iteration, so b.ResetTimer() is no longer required unless the setup happens
inside the loop body.
When each iteration needs fresh data (e.g., sorting an unsorted slice), use
b.StopTimer() and b.StartTimer():
sort_test.go
func BenchmarkSort(b *testing.B) { for _, size := range []int{100, 1000, 10000} { b.Run(fmt.Sprintf("size=%d", size), func(b *testing.B) { original := make([]int, size) for i := range original { original[i] = size - i // reverse-sorted = worst case } b.ResetTimer() for i := 0; i < b.N; i++ { b.StopTimer() data := make([]int, len(original)) copy(data, original) b.StartTimer() sort.Ints(data) } }) }}
b.StopTimer() and b.StartTimer() have overhead. If the per-iteration setup
is extremely cheap relative to what you are measuring, the timer overhead may
distort results. Use this pattern only when the setup cost is significant.
Compare this with the sequential result (31076 ns/op) — the parallel version
runs ~5x faster on 8 cores, showing that this CPU-bound workload scales well
across threads.
Do not call b.StopTimer(), b.StartTimer(), or b.ResetTimer() inside
b.RunParallel. They have global effect and will corrupt measurements. Each
goroutine must maintain its own local state.
Use b.SetParallelism(n) to increase concurrency beyond GOMAXPROCS for
I/O-bound workloads:
If a computation’s result is unused, the Go compiler may eliminate it entirely.
This is the single most common source of misleading benchmark results.
Dead code elimination
// BAD: result is unused — compiler may eliminate the call entirelyfunc BenchmarkBroken(b *testing.B) { for i := 0; i < b.N; i++ { Fibonacci(20) // may report ~0 ns/op }}// GOOD: b.Loop() prevents the compiler from optimizing away the bodyfunc BenchmarkCorrect(b *testing.B) { for b.Loop() { Fibonacci(20) }}
If you must use the b.N pattern (Go < 1.24), pass the result to
runtime.KeepAlive so the compiler treats it as observed:
runtime.KeepAlive pattern
func BenchmarkCorrect(b *testing.B) { var r int for i := 0; i < b.N; i++ { r = Fibonacci(20) } runtime.KeepAlive(r)}
Using b.N as a function parameter means the workload grows with the iteration
count. The benchmark never converges and reports meaningless numbers:
b.N misuse
// BAD: workload grows with b.N — benchmark never convergesfunc BenchmarkBad(b *testing.B) { for i := 0; i < b.N; i++ { Fibonacci(i) // i grows, each iteration is slower }}// GOOD: fixed inputfunc BenchmarkGood(b *testing.B) { for b.Loop() { Fibonacci(20) }}
Close background processes, avoid running on battery, and disable CPU throttling
when collecting benchmark data. Noise from other processes can mask real
performance changes.
Never eyeball raw ns/op numbers to decide if a change helped. Run with
-count=10 and use benchstat to test for statistical significance. With ~20
benchmarks at alpha=0.05, expect ~1 false positive.
Always use -benchmem or b.ReportAllocs(). Even if latency stays flat,
increased allocations put pressure on the garbage collector and cause latency
spikes under production load.
Table-driven sub-benchmarks let you test across input sizes, data shapes, and
configurations in a single benchmark function. They also enable filtering from
the command line.
Here’s how to integrate CodSpeed with your Go benchmarks:
1
Set Up GitHub Actions
Create a workflow file to run benchmarks on every push and pull request.
2
Check the Results
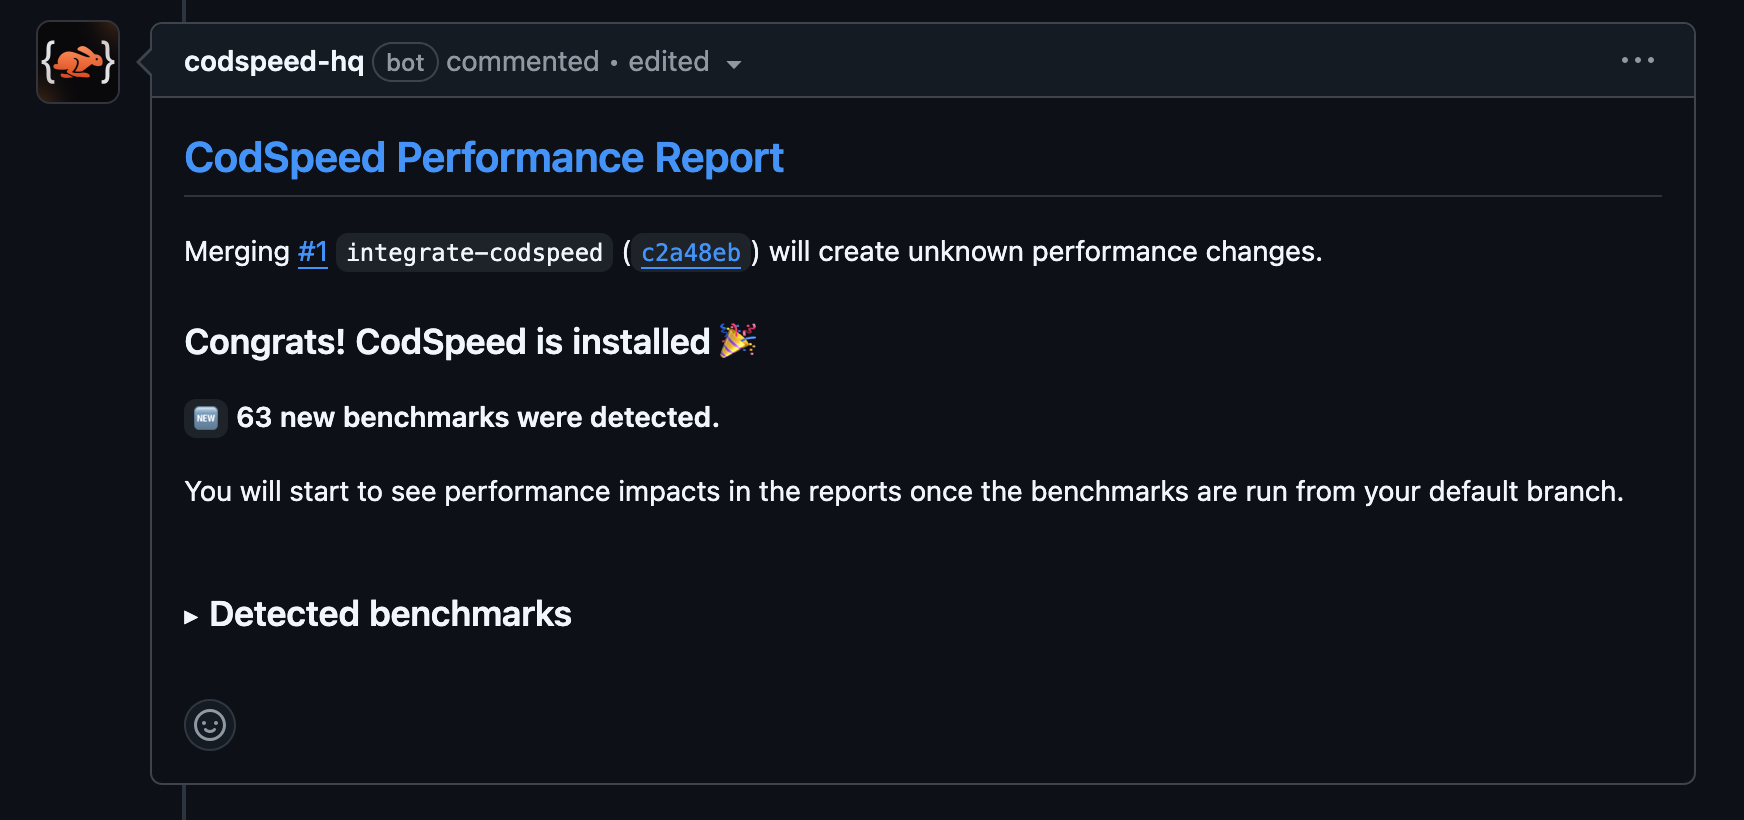
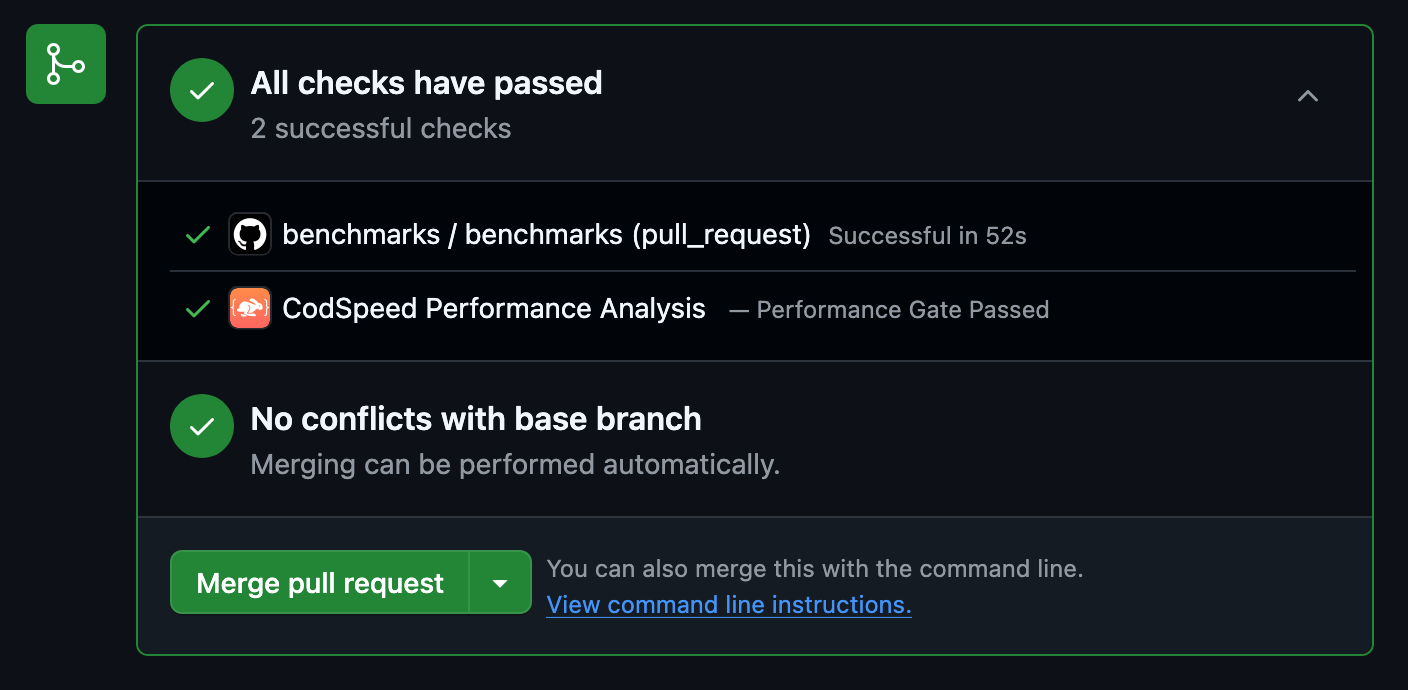
Once the workflow runs, your pull requests will receive a performance report
comment:
3
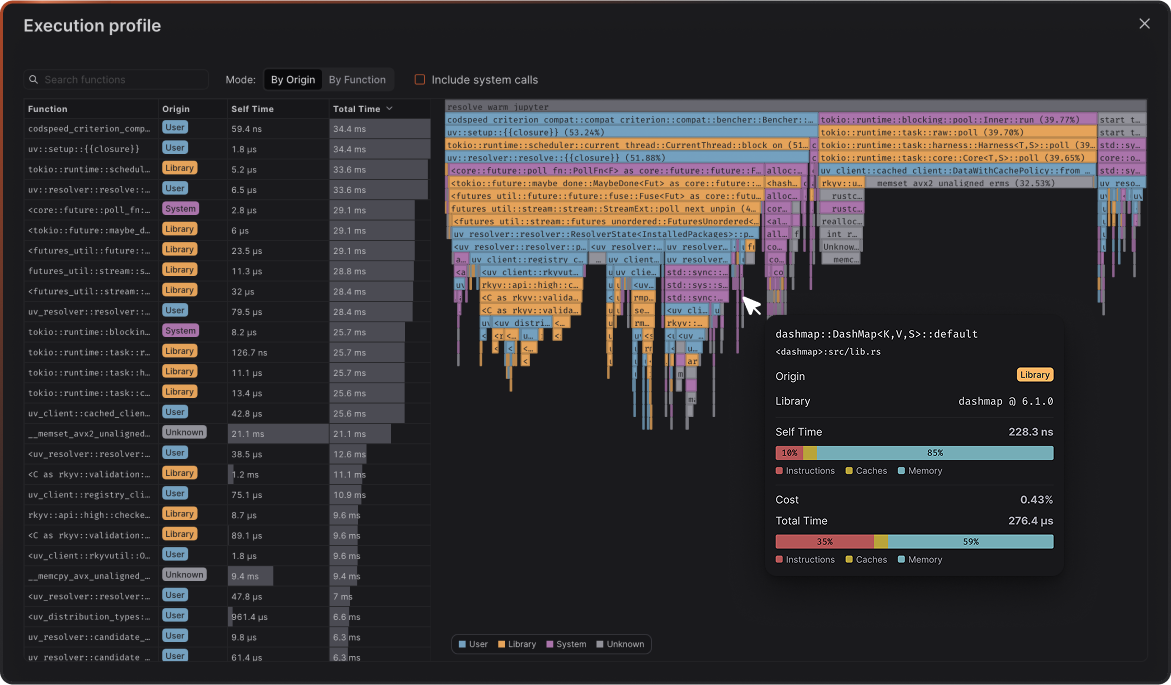
Access Detailed Reports and Flamegraphs
After your benchmarks run in CI, head over to your CodSpeed dashboard to see
detailed performance reports, historical trends, and flamegraph profiles for
deeper analysis.