

testing
package and CodSpeed. We’ll create a minimal API, design clean benchmarks
measuring what matters, and run them in CI with consistent results.
Prerequisites
- Basic knowledge of Gin and HTTP
- Go 1.24+ (for using
b.Loop()withtesting.B) - A GitHub repository (to run CI examples)
Creating a base Gin API to work with
Let’s start with an API from the official Gin tutorial. If you never have used Gin before, following this tutorial is a great way to get started before we start benchmarking. We’ll organize the project so benchmarks target a library package while you still have a runnable server for manual testing.api.go
The only difference here with the original code is that we’re now using the
api package name instead of main for compatibility reasons.GET /albums: Returns all albumsGET /albums/:id: Returns a specific album by IDPOST /albums: Creates a new album
terminal
GET `/albums`
GET `/albums`
terminal
Response
GET `/albums/:id`
GET `/albums/:id`
terminal
Response
POST `/albums`
POST `/albums`
terminal
Response
Adding benchmarks to the API
Now, let’s get started writing performance tests to actually measure the performance of each route of this API. First, we need to do a bit of refactoring to make it easier to write benchmarks.Isolating the router
In the initial code, the router is created and configured in themain
function. This is not ideal for any tests or benchmarks because it’s impossible
to reuse the router configuration.
Let’s isolate the router creation and configuration in a separate function:
api.go
Writing the first benchmark
Now, let’s write the first benchmark for theGET /albums route, strongly
inspired by
the Gin documentation on writing tests:
api/api_test.go
b.Loop(), measuring the time it
takes for each iteration.
Let’s run it:
terminal
- First we can see in the
[GIN]logs that our request takes roughly 2µs on average. This is an interesting reference point but actually not the source of truth we’ll use for our benchmark results. - The benchmark name
BenchmarkGetAlbums-10has the-10suffix, which means it ran on 10 CPU cores. - It ran 54,296 times, taking an average of 21,328 ns per operation (which translates to 21.328 µs per request in our case).
- Overall, benchmarking this module took 1.460 seconds.
- There is a significant overhead in our measurement: we end up measuring ~21µs per request, but the reported timing of a single request by the router is ~2 µs. That means 90% of what we measure in not what’s happening in the router.
- As mentioned in the logs, Gin is running in debug mode here: since we want to measure something as closely related to what happens in prod, we should run the router in release mode to measure realistic performance.
- The output of the router is very verbose, while it’s very convenient for integration or unit tests, it’s harmful to have all those logs in the benchmark since we’re also measuring STDOUT performance here.
Configuring the router for benchmarking
To fix those issues, we can create a helper function to set up the router specifically for benchmarking:terminal
Optimizing the Response Writer
Since the beginning, we reused thehttptest.NewRecorder() inspired by the Gin
testing example to get a response writer. This is necessary because Gin’s
ServeHTTP method requires an http.ResponseWriter to handle the HTTP
response, and httptest.NewRecorder() provides a concrete implementation that
captures the response for inspection.
This is convenient but introduces some extra costs not really worth measuring in
our case:
- Extra useless allocations
- JSON buffering to capture the responses
- JSON processing to handle the responses
httptest.NewRecorder():
- Discards all data instead of storing it
- No allocations - just returns success without buffering
- Minimal CPU overhead - simple length calculation for Write()
The benchmark factory
Now, we can combine all those changes into a single helper function to create a benchmark for a given request:Scaling up the benchmarking suite
Now, let’s add some more benchmarks for the other routes and scenarios:api_test.go
terminal
Running the benchmarks in CI
Local benchmarks are excellent for development iteration, but running benchmarks in CI provides consistency and automation that local benchmarking can’t match:- Consistent hardware: CI runners eliminate the “works on my machine” problem. Your laptop’s thermal throttling, background processes, and varying load create noise that masks real performance changes.
- Automated detection: Catch performance regressions before they reach production. Every PR gets benchmarked automatically, making performance a first-class concern like tests.
- Historical tracking: Build a performance timeline across commits. Spot trends, identify when regressions were introduced, and validate that optimizations actually worked.
- We’re using the
codspeed-macrorunners to run the benchmarks on an optimized and isolated CI machine, removing noise from virtualization and shared resources. Check out the Macro Runners page for more details. - We’re again using the
-benchtime=5sflag to run the benchmarks for 5 seconds each, making sure we get enough samples to get a good estimate of the performance. Feel free to change it to your needs.
This example is for GitHub Actions, but you can use CodSpeed with any other CI
providers. Check out the CI integration docs for more
details on the CI integration.
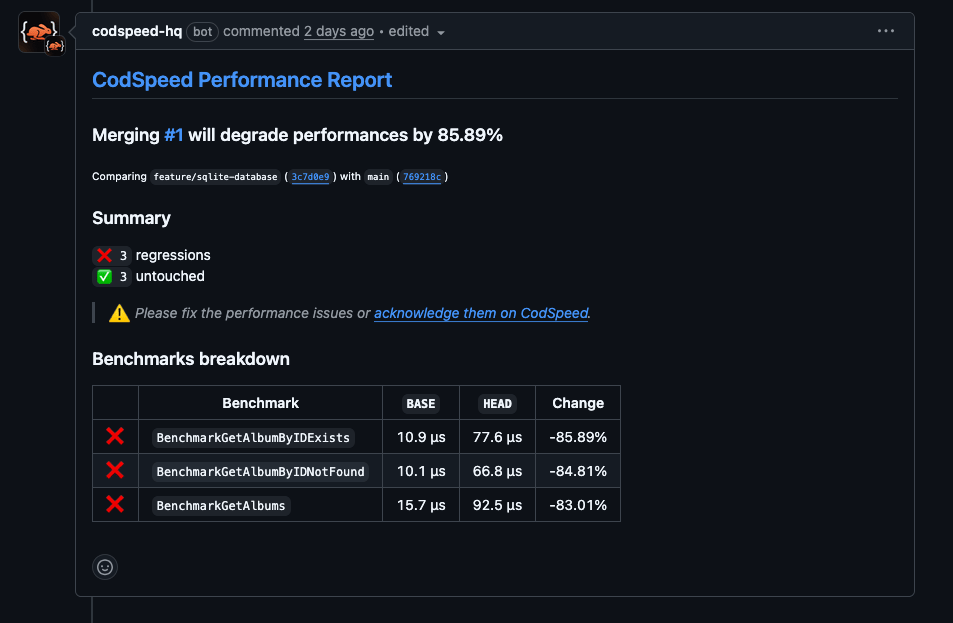
Github Comment on the with the benchmark results
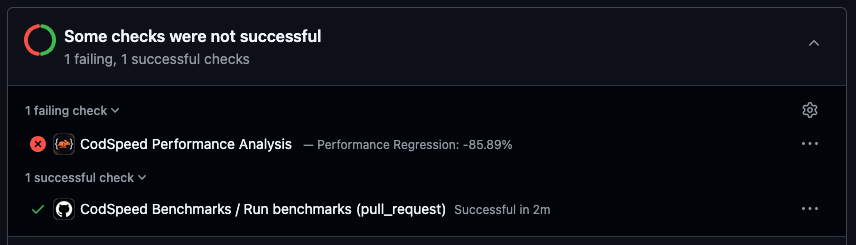
Status check on the pull request which can be used to prevent merging regressions
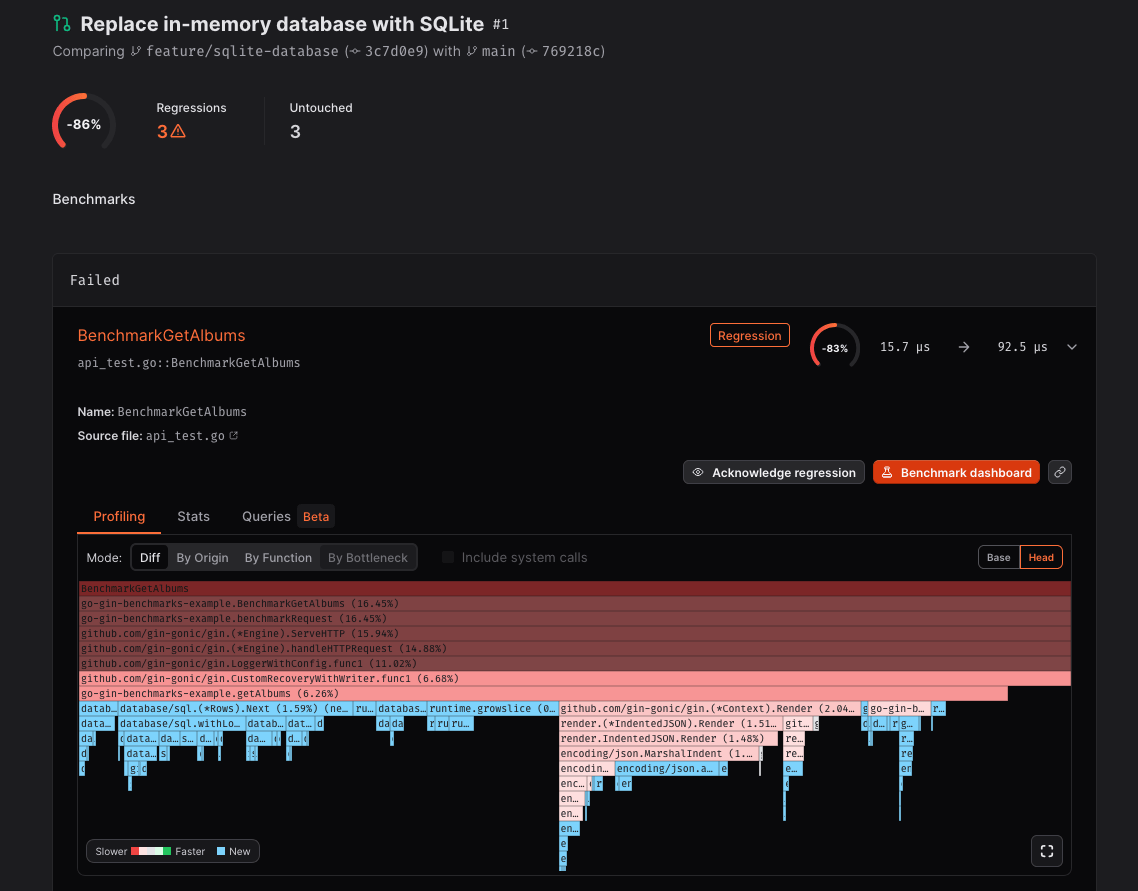
Performance report with the Differential Flamegraph
getAlbums (in red)
introduced by the new (in blue) database/sql usage.
However, we can see that there is almost no difference in the postAlbum
benchmark:

postAlbum function
are important but only impact 0.1% of the total time:
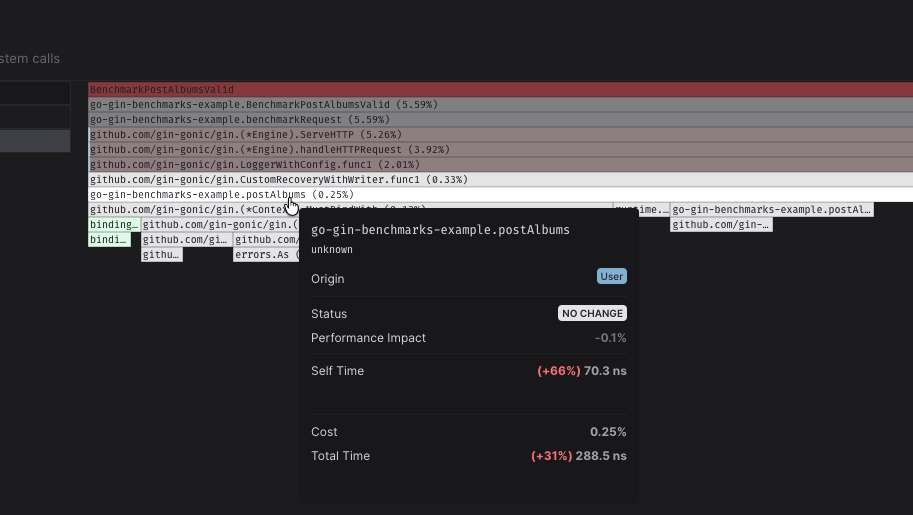
The function is getting 31% slower but only impacts 0.1% of the total time
Next steps
Now that you’ve seen how to benchmark a Go Gin API, you can start benchmarking your own code! Here are some useful resources:Source code
The example GitHub repository for this guide with all the code and Pull
Requests.
Go integration documentation
All the details about CodSpeed’s Go integration.
Walltime instrument
Learn more about the Walltime instrument and how to use it.
Dive in performance changes
Learn more about profiling and how to read flame graphs.
Benchmarking Cookbook
Gin benchmark utilities:gin_benchmark_utils.go
api_test.go
See Go integration notes and compatibility in the Go benchmarks
guide.