

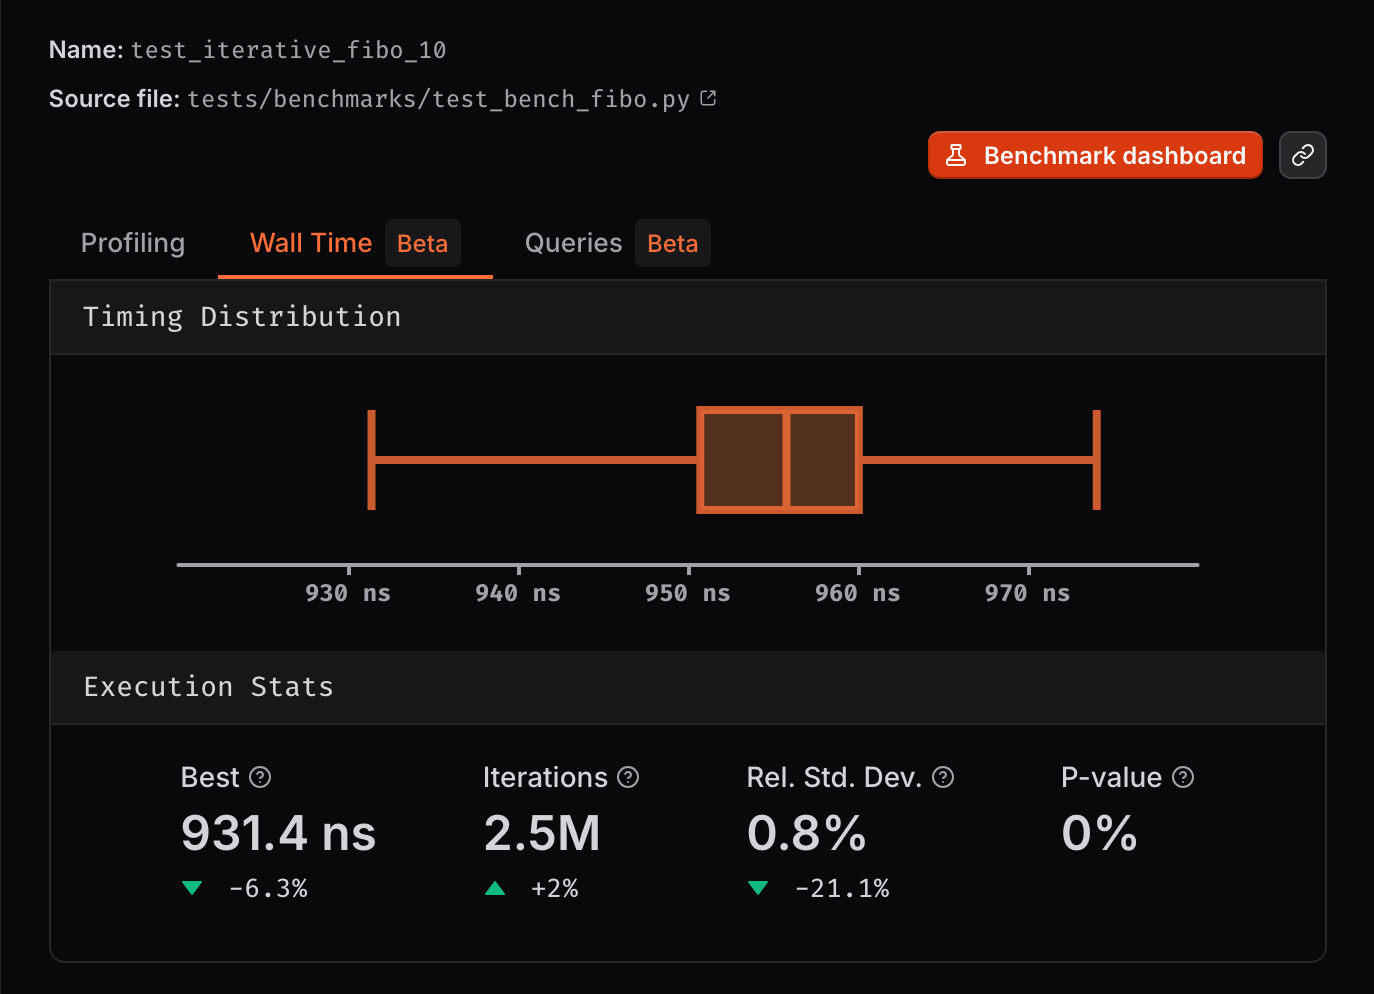
Example of a walltime benchmark run
What Does the Walltime Instrument Measure?
The walltime instrument measures the actual elapsed time (also known as “wall clock time”) of your benchmark execution. Unlike CPU simulation which measures simulated CPU cycles, walltime captures the real-world duration including:- All code execution: Both user-space code and system calls are included in the measurement, giving you a complete picture of actual runtime performance.
- I/O operations: Network requests, file system operations, and other I/O bound tasks are fully captured, making this instrument ideal for benchmarks that interact with external systems.
- Parallelism effects: Multi-threaded code benefits are accurately measured since walltime reflects the actual elapsed time, not CPU time across threads.
Multiple benchmark processesWith the walltime instrument, you should try and avoid running multiple
benchmark processes in parallel since this can lead to noisy measurements.Thus, using
pytest-xdist or similar tools is not recommended.Automated Profiling
When using the walltime instrument, CodSpeed automatically collects profiling data and generates flame graphs for each benchmark. This allows you to quickly identify performance changes and their root causes.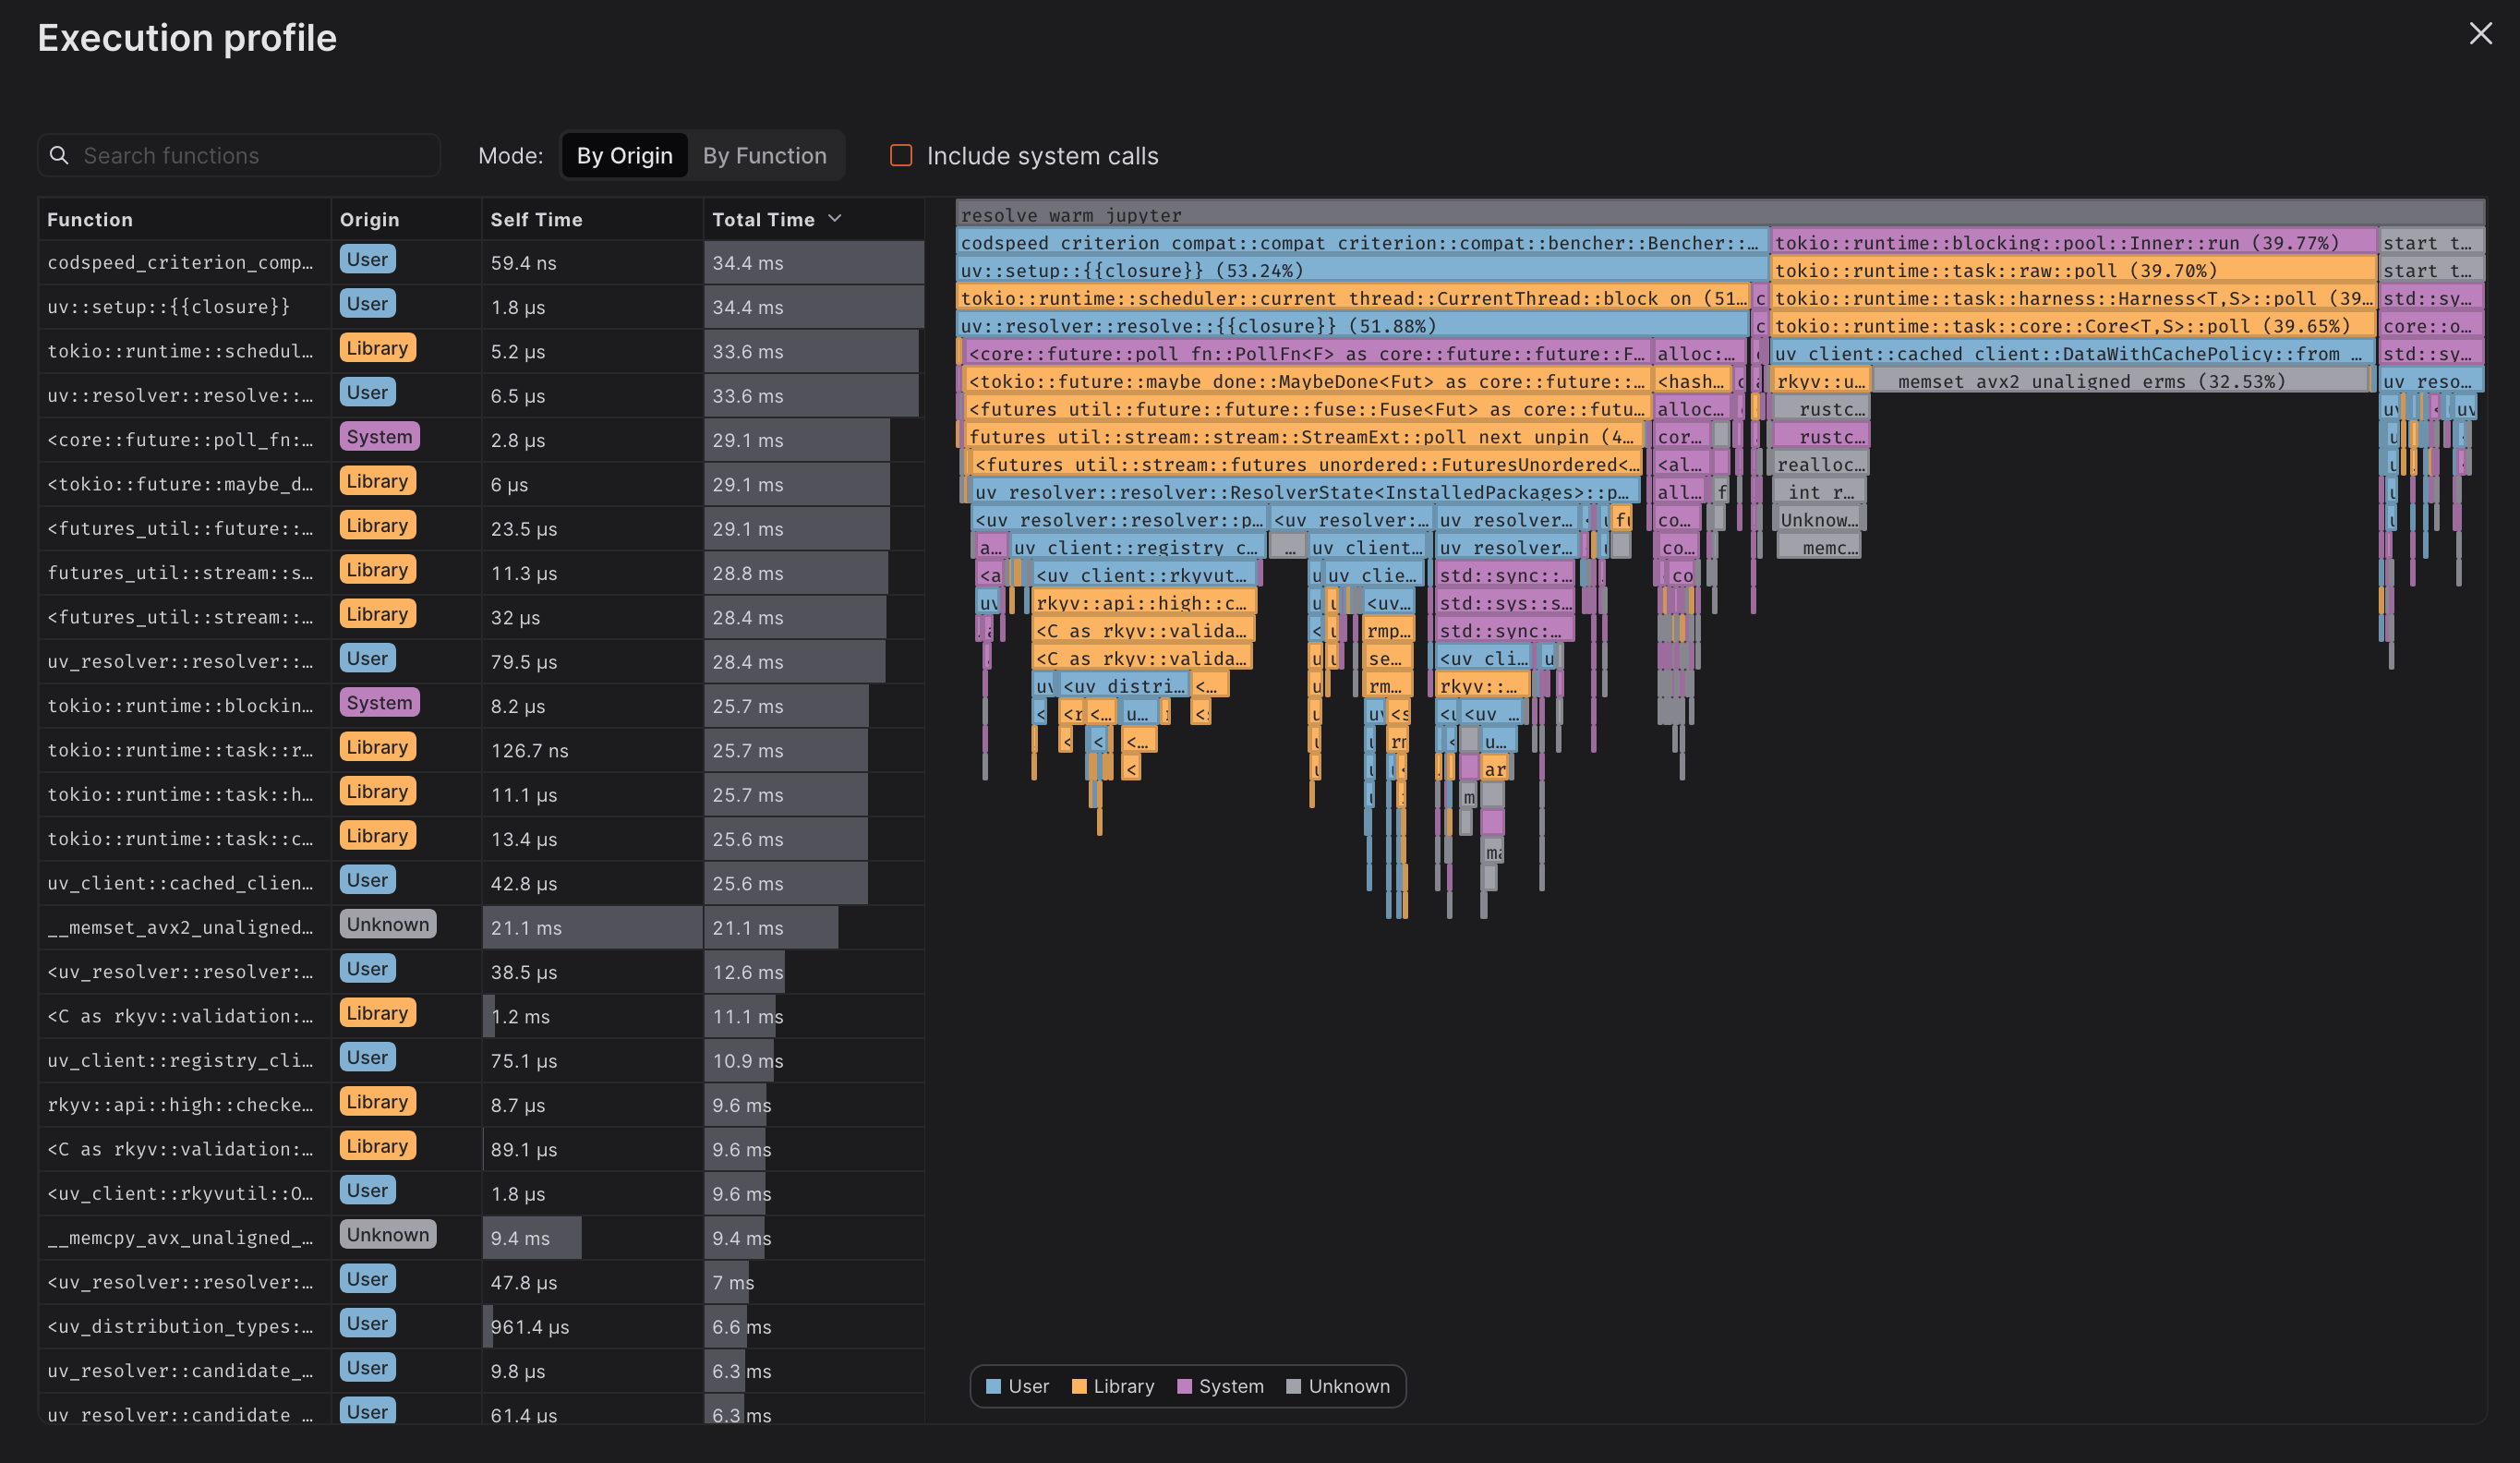
Inspector Metrics
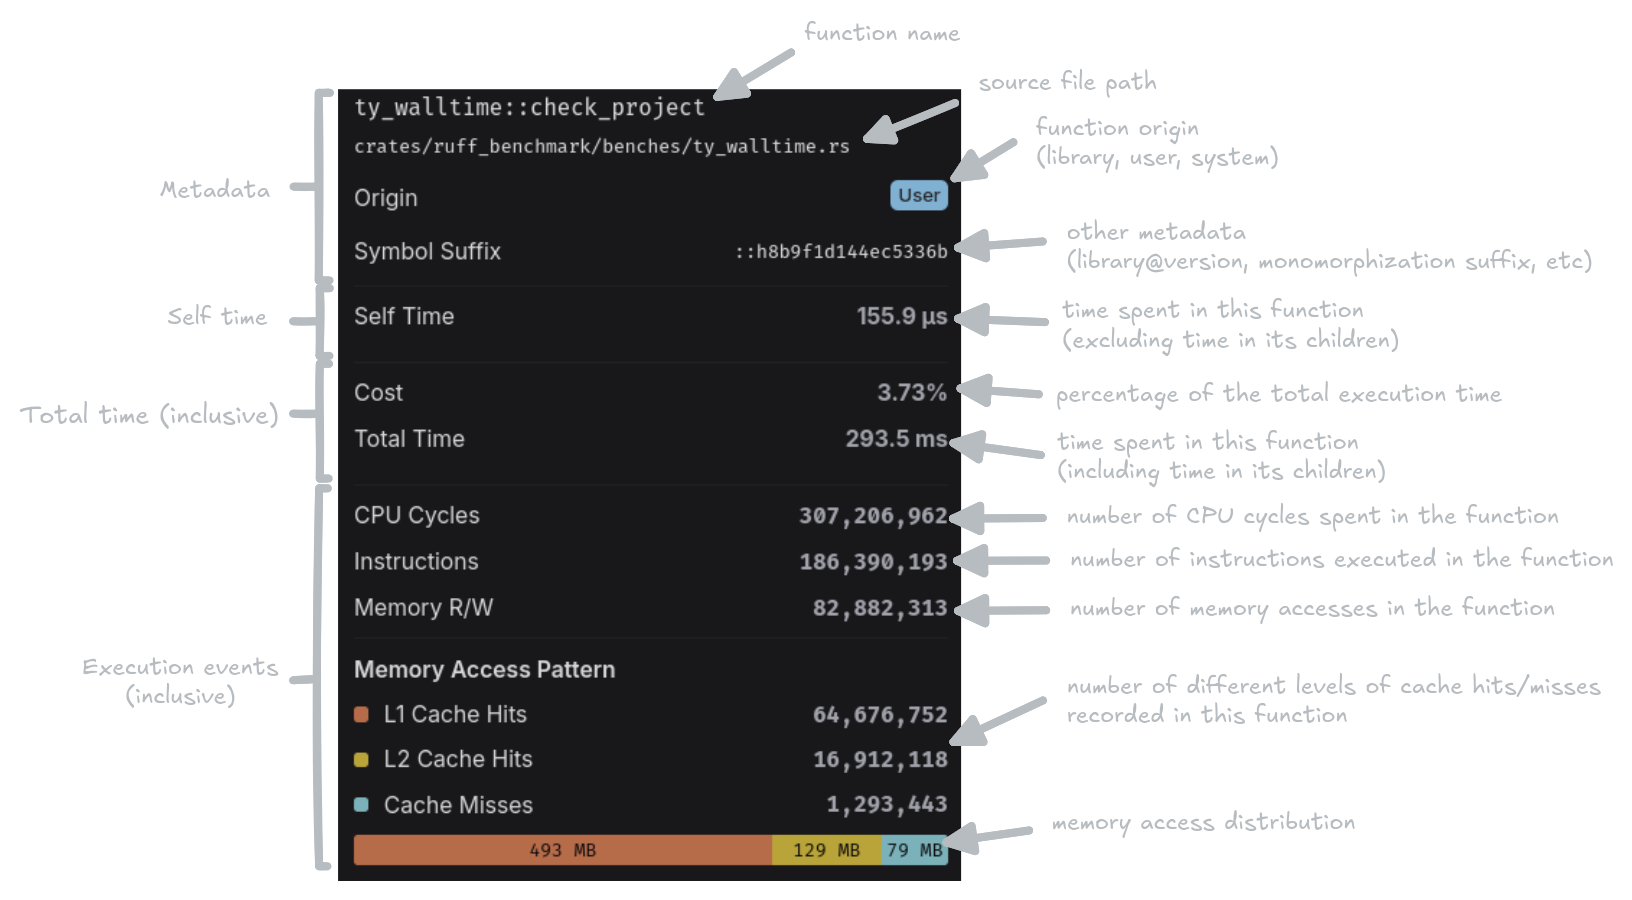
- Self time: The measured execution time spent in the function body only, excluding time spent in child function calls.
- Total time: The measured execution time spent in the function including all its children.
- CPU Cycles: The number of CPU cycles elapsed.
- Instructions: The number of CPU instructions executed.
- Memory R/W: The number of memory read and write operations performed.
- Memory Access Pattern: A breakdown of how memory accesses were served:
- L1 Cache Hits: Memory accesses served from the fastest CPU cache.
- L2 Cache Hits: Memory accesses served from the second-level cache.
- Cache Misses: Memory accesses that required fetching from main memory.
- Memory access distribution: Total bytes read from and written to memory, for each level of cache. It is calculated based on the number of events, and the average size of each access, namely a word for a cache access, and a cache line for a cache miss.
Sampling accuracyEvent counts are collected using hardware performance counter sampling. The
deeper you navigate into leaf functions, the more susceptible these counts
suffer from to sampling-related inaccuracies. For the most reliable data, focus
on higher-level functions in the call stack.
Compatibility
To enable profiling with the walltime instrument, ensure you meet the following minimum version requirements:Running Walltime Benchmarks
Walltime is an instrument of the CodSpeed CLI: pass--mode walltime to
codspeed run, in front of your benchmark command.
mode input instead:
Measuring in CI using Macro Runners
Walltime measures elapsed time, so it inherits the noise of the machine it runs on. A shared CI runner sits on a host with other tenants, whose load changes from one run to the next and moves a benchmark by more than the regressions you want to catch. Macro runners are bare-metal machines dedicated to your job and tuned by CodSpeed for stable measurements, so a difference in walltime reflects a change in your code.Macro Runners on GitHub Actions
Change the runner label of the benchmark job
Macro Runners on CircleCI
Point the benchmark job at a CodSpeed resource class
Next Steps
Macro Runners
Learn more about CodSpeed managed bare-metal runners designed for Walltime
benchmarks
Profiling
Learn more about automated profiling for Walltime benchmarks
Profiling on macOS
Learn why system processes are missing from macOS profiles and how to work
around it